In most cases, a website aims to turn visitors into leads and leads into paying customers. This journey can be very difficult to track and evaluate without any kind of relevant website data.
This is where web metrics and web analytics come into play.
One such platform is Google Analytics 4.
Analytics platforms grant you access to website data and website metrics that help you understand how visitors find your website, behave once on your pages, and engage with your website content.
Although different types of websites aim at different goals, and therefore different Google metrics for websites are being monitored for different website projects, there are still several universal metrics that are important for each website.
Table of contents:
- What is a Metric in Google Analytics 4
- 12 Most Important Website Metrics to Track in Google Analytics 4
Read also:
- How to Seet Up Google Analytics 4 on Your Website
- How to Navigate Google Analytics 4
- What is SEO and How Does it Work
- What are Keywords
- What is PageRank? A Quick History Lesson
- How to Get Started with Affiliate Marketing
What is a Metric in Google Analytics 4
In Google Analytics 4 (GA4), website analytics metrics are quantitative aspects of user behavior on your website.
Site analytics metrics are always displayed in numbers and give you precise information about how your website is performing and what site visitors are doing once landed on your pages.
Furthermore, metrics can help you monitor how effective your marketing campaigns are and give you insight into how you can improve your website for optimal performance and conversion rate.
An example of a metric is website visitors. Such a metric can be measured for a certain period. For example, a given website can have 57,439 website visitors in the last 3 months.
Another example of a metric is session duration. It showcases how much time site visitors spend on your website on average.
Yet other examples include numbers of button clicks, page views, following links, and making purchases.
There are many website metrics you can monitor via GA4 and in the next paragraphs, you will read about the most important ones.
12 Most Important Website Metrics to Track in Google Analytics 4
There are several very important website metrics that you should be aware of and constantly check when you are working on your Google Analytics 4 reports:
- Users
- Page Views
- Average Time on Page
- Event Count
- Session Duration
- Bounce Rate
- New Visitors
- Returning Visitors
- Conversion Rate
- Landing Pages
- Exit Pages
Users
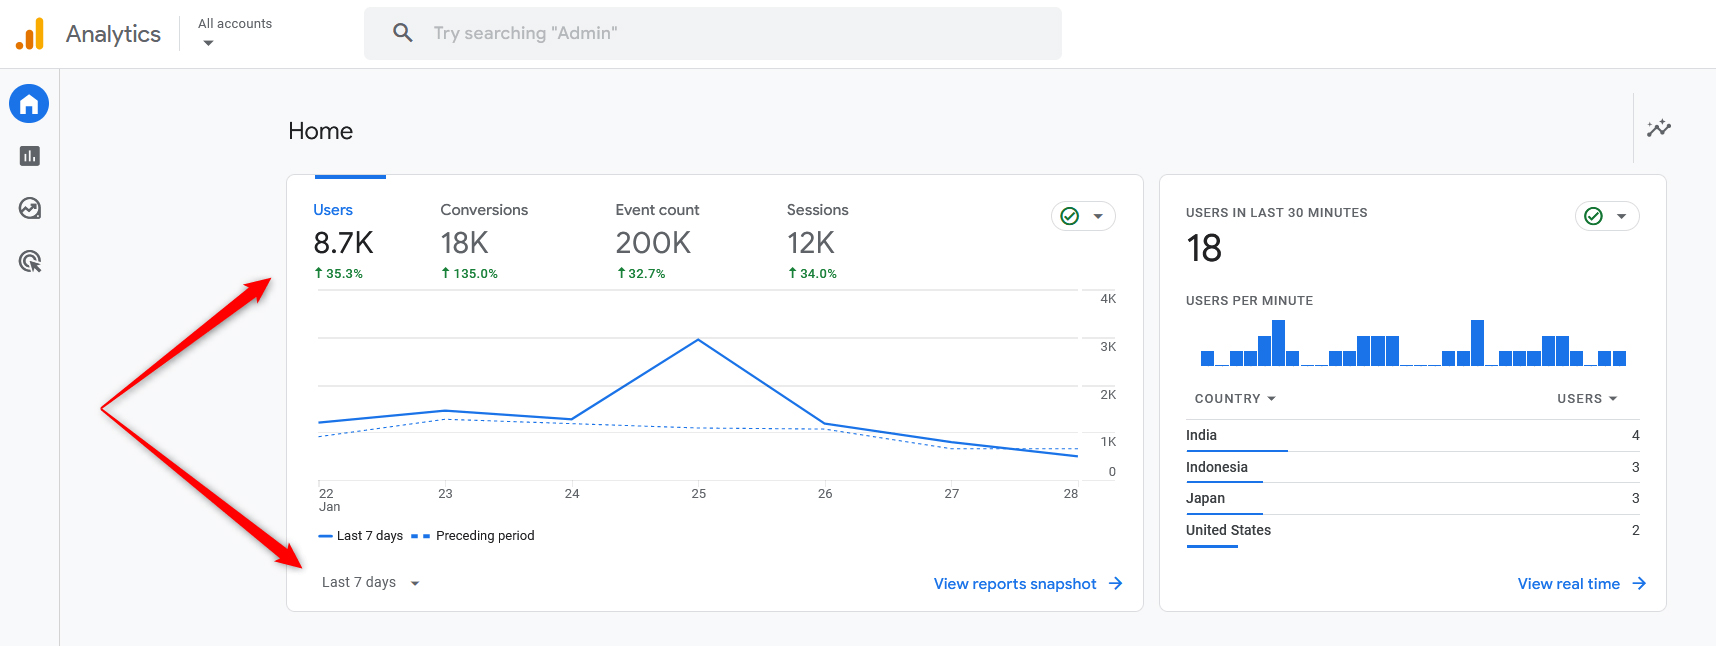
Users is a website analytics metric that showcases how many individual site visitors have viewed and interacted with your website. This metric is always bound to time boundaries – the number of site users is always counted within a specific period.
For example, you can count the number of site users for today, the last month, the last four months, or, for a bigger period – for the last year, for example.
The greater the number of users, the better your website is performing.
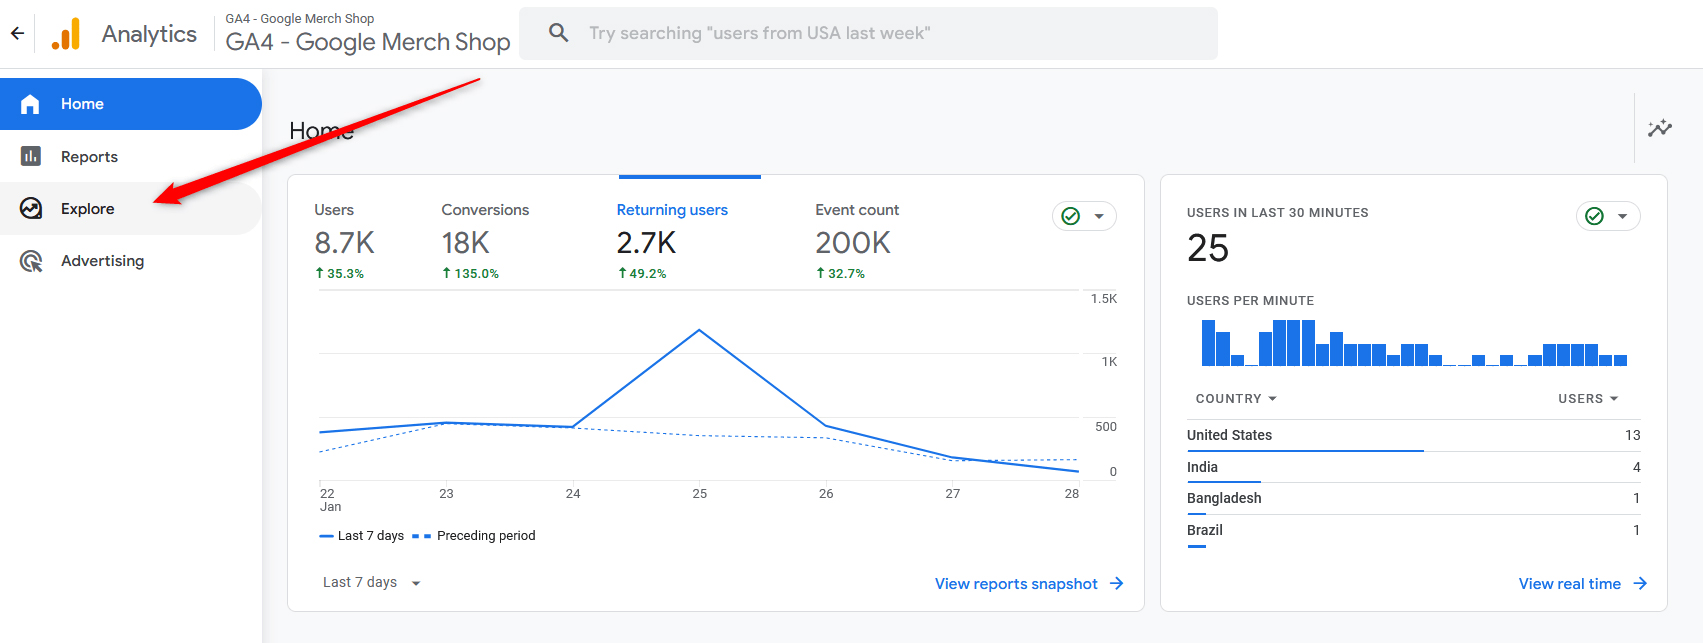
You can quickly see the number of your site analytics metrics about your visitors via the home section in GA4:
Page Views
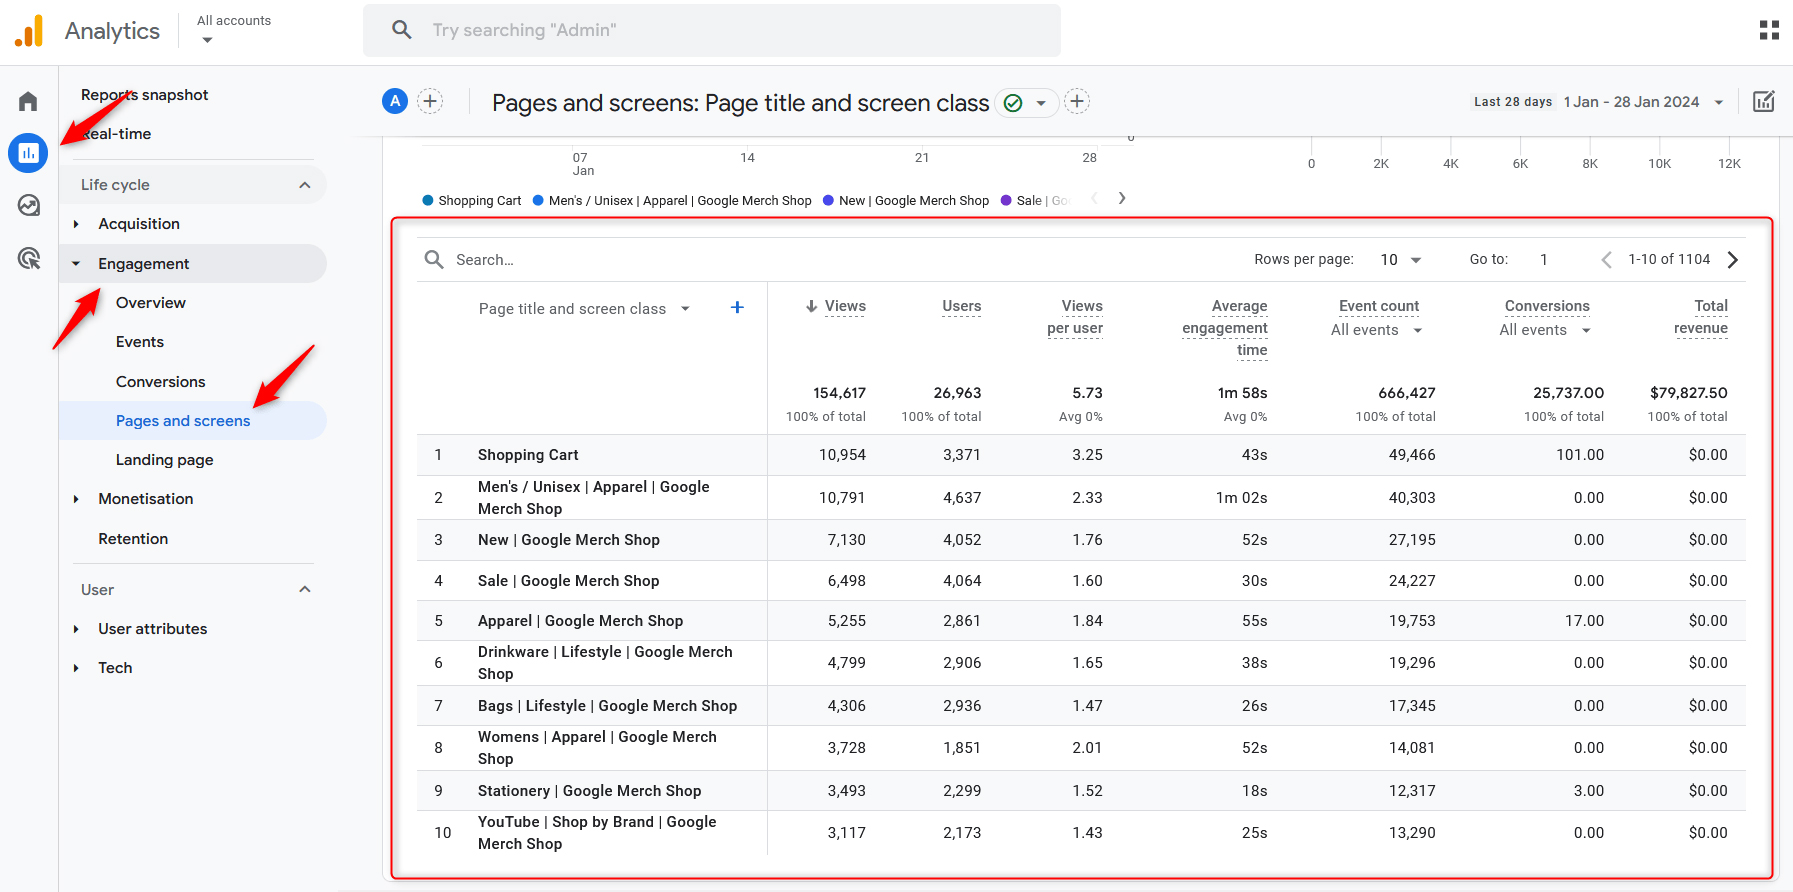
The page views metric measures the number of times a given page on your website has been seen by visitors.
Each time a web page loads in a given web browser, a page view is counted.
Similar to the Users metric, Page Views can be measured in a specific period – for the past week, for the past 4 months, for the last year, or any other custom period.
Keep in mind that a certain visitor can open a single page more than once and each time they do so, a count to the Page Views is being added.
Page Views help you get an overall insight into which web pages of your websites are most popular and most often loaded. Use this data to include important links on such pages, offers, contact and registration forms, CTA buttons, and ads, should you decide to monetize your website.
In most cases, the greater the Page Views number is, the better your website is performing.
To monitor page views in GA4, via the home screen go to Reports->Engagement->Pages and Screens and have a look at the chart:
Average Engagement Time
Average engagement time in GA4 is a time metric, describing the average time each user spends on any page on your website. Page exits and bounces are not included (we will be checking these further in this article).
The average engagement time is not unique for each site visitor. This metric takes the number of all page views for some time and divides this number by the overall time spent by all visitors for this same period.
For example, if there have been 3000 page views for a month, who altogether spent 600 minutes on any page, the example average time would be:
600 minutes/3000 page views = 0.2 minutes, or 12 seconds.
To monitor the metric, via Reports navigate to Engagement->Pages and Screens and check the Average engagement time column in the chart:
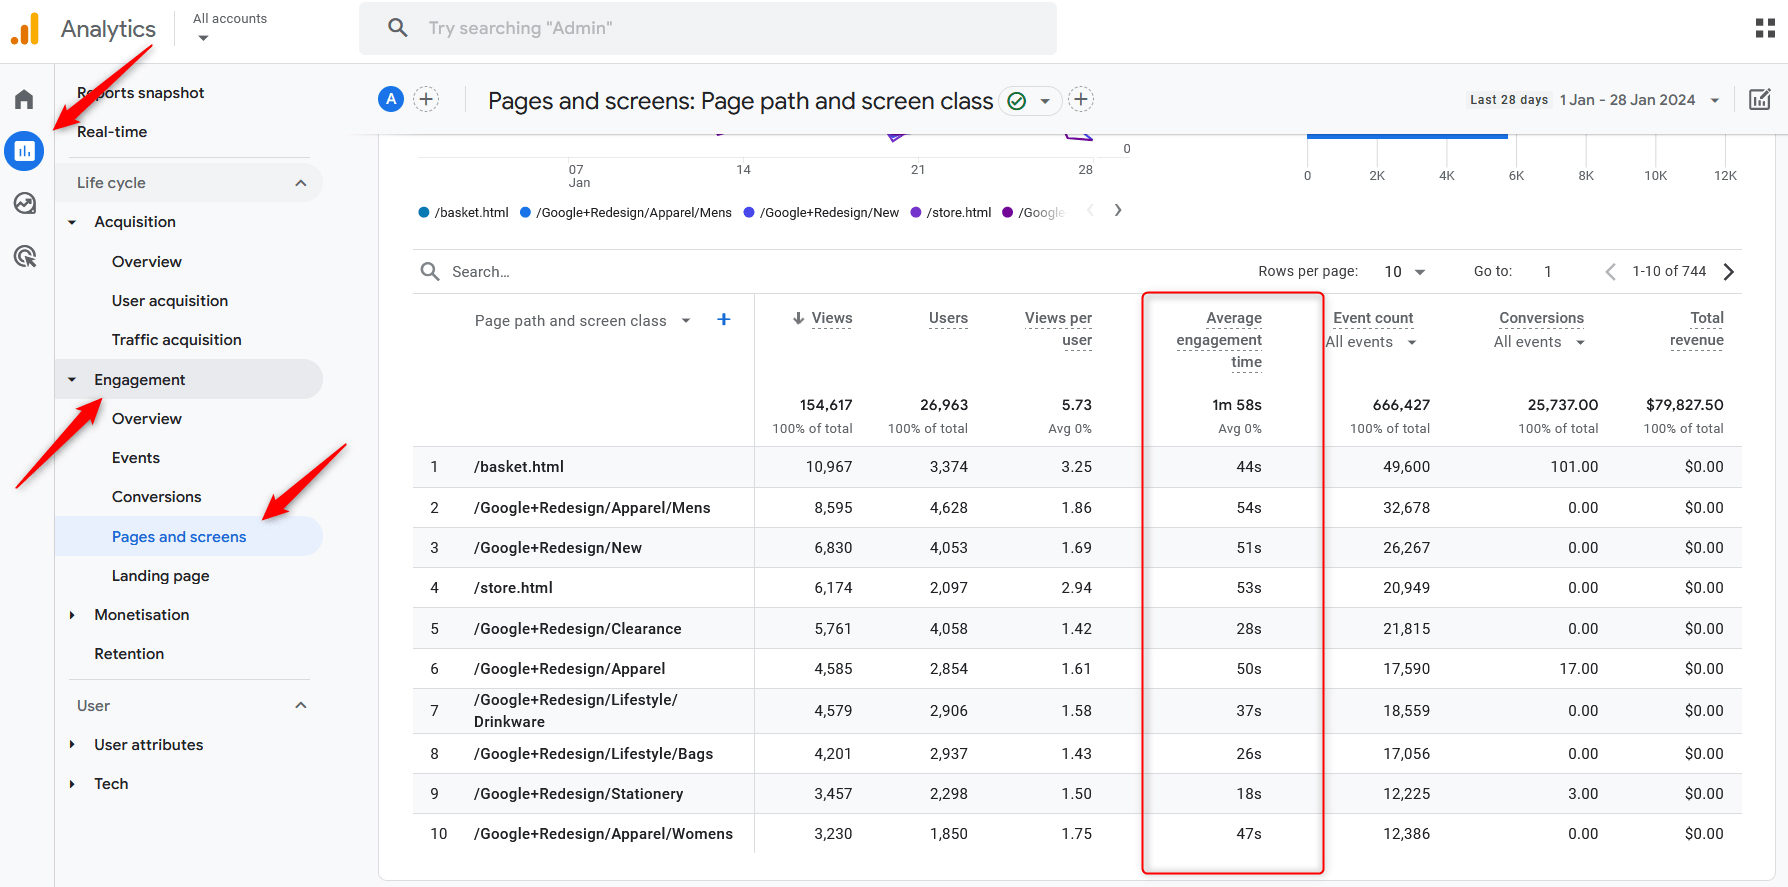
Via this metric, you can monitor on which pages your site visitors stay the most and use this information to your advantage – add more CTA buttons on them, prompt them to fill out a registration form, or add some ads that can ensure more revenue.
Event Count
Event count is a very important metric, regardless of the industry and niche your website operates in.
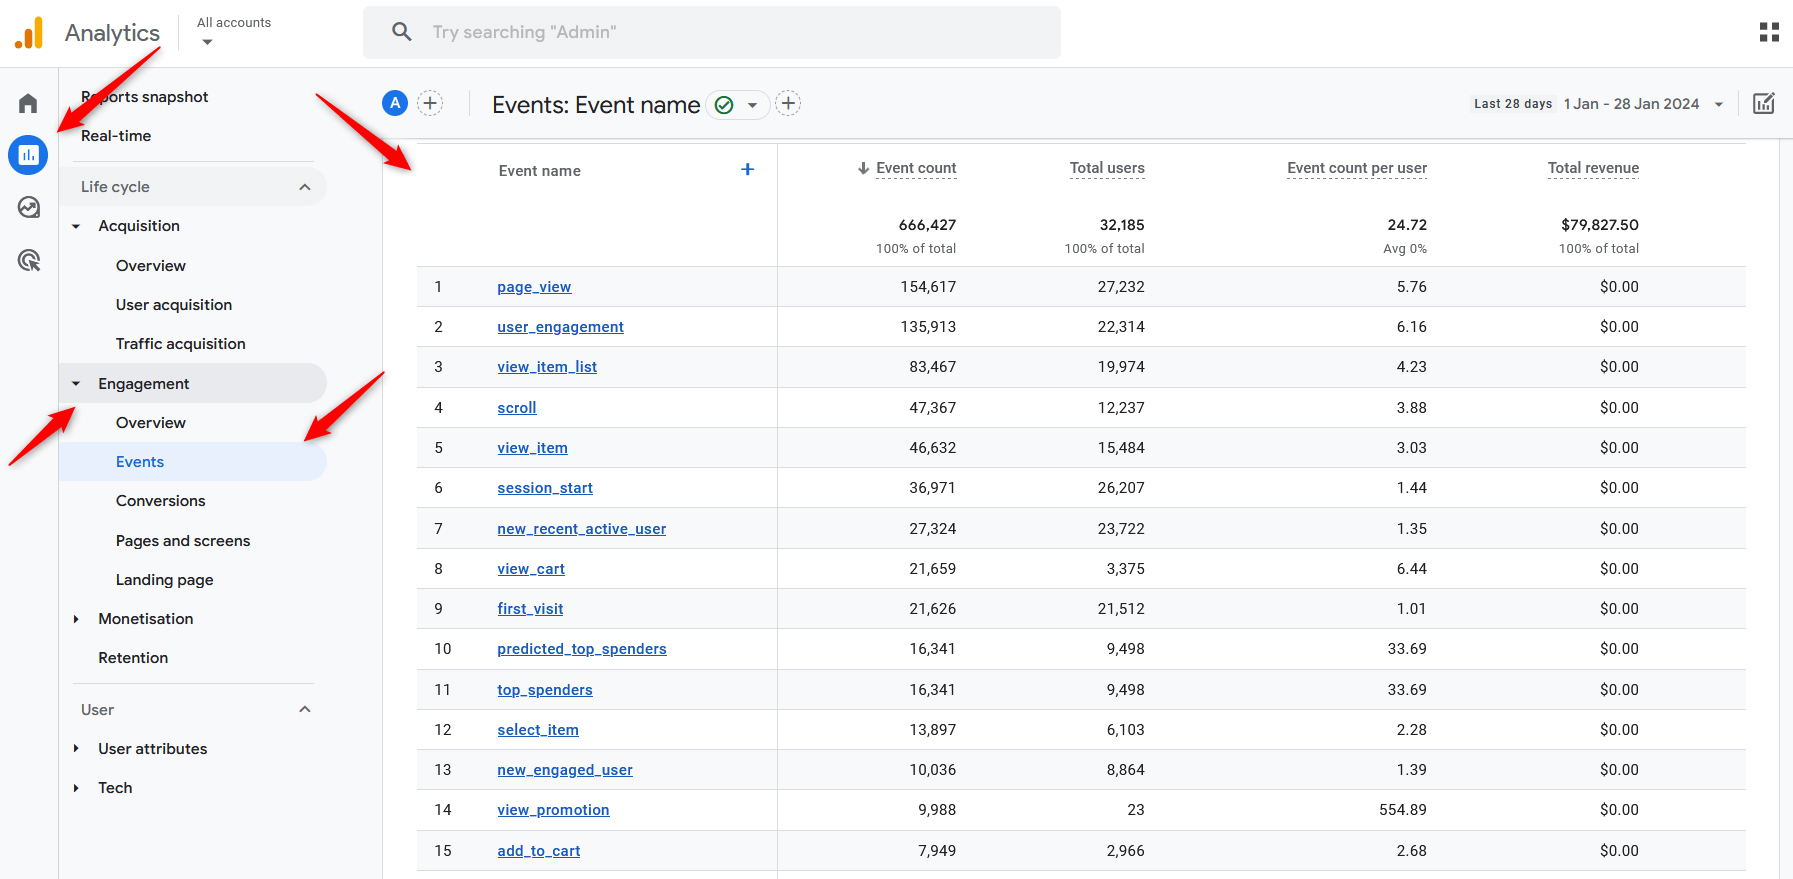
Events mark specific types of visitor engagement on your website. In most cases, events mark site visitor activity that is of greater importance for your website and business.
Examples of Events are clicks, following links, filling up a registration form, adding products to the shopping cart, checking out, and completing a purchase.
To see the Event Count number in GA4, via Reports, head to Engagement->Events:
Average Session Duration
A session in GA4 is a set of interactions with your website that a single user has completed within a given period.
For example, a user opens your website, scrolls down the page, fills up the registration form, then opens another page, browses some of your e-commerce products, adds some to their shopping cart purchases these, and then leaves your website. If all these activities and events take place within 30 minutes, then they all are considered as a single session.
Session duration is simply the time it takes for a single session to start and to end.
Durations are important, as they indicate how much your site visitors are engaged with your website. The greater the session duration, the bigger the interest in your website is.
Another term, directly connected to sessions, is engaged session. This is a session that lasted longer than 10 seconds, has a conversion, or at least 2 different page views or screen views.
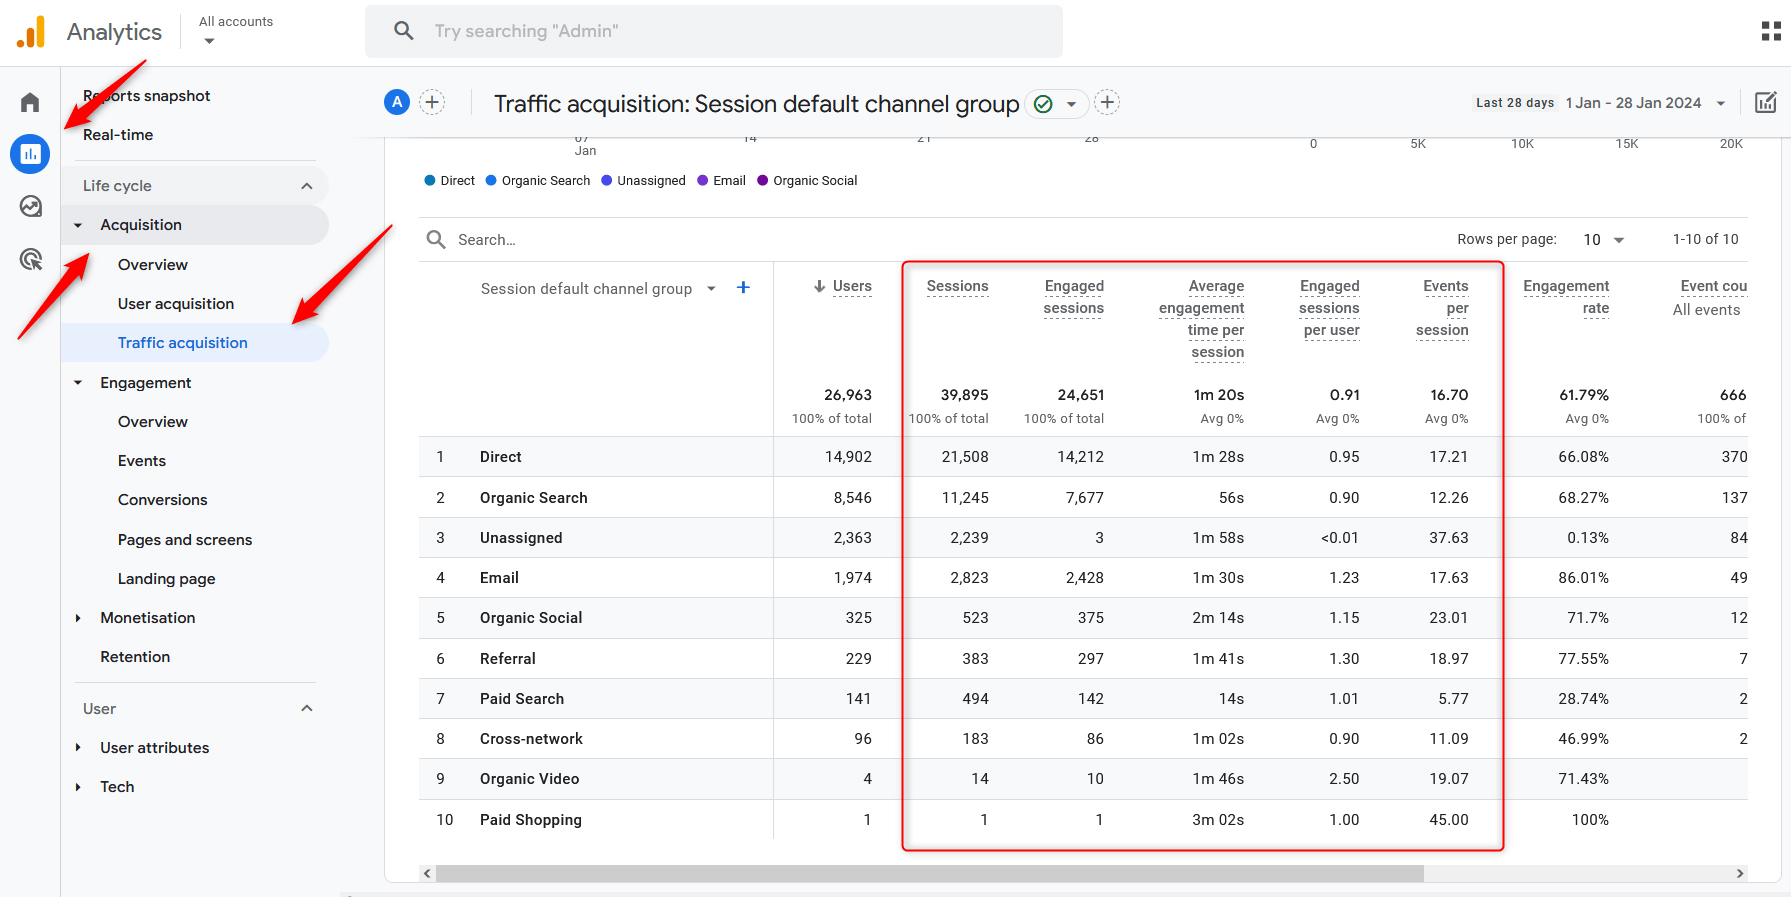
To monitor sessions and session duration in Google Analytics 4, via Reports, go to Acquisition->Traffic Acquisition and have a look at these columns:
Bounce Rate
Bounce rate can be a bit tricky to understand, however, it is important to know what this metric is all about, as it is also essential for your website.
In short, the bounce rate is the complete opposite of an engaged session.
An engaged session in GA4 is a session that lasted more than 10 seconds, triggered an event, or triggered 2 or more pages.
To have a bounce in Google Analytics 4, a session should be below 10 seconds, not trigger any event, or have only a one-page view.
In most cases, the bounce rate is calculated in percentage by dividing the number of bounces by the overall number of sessions for a given period. Then, the result is multiplied by 100.
For example, your site had 1500 sessions in the last month. 600 of those were engaged sessions. This means that the rest are bounces (1500–600=900).
Then you take these 900 sessions and divide them by the number of overall sessions – 1500:
900/1500 x 100 =60% bounce rate.
New Visitors
The New Visitors metric showcases the overall number of visitors who come to your website for the first time.
New users are defined by the unique ID that is logged in the GA4 database once a new visitor loads your website.
In most cases having new visitors is a sign that your website is growing and your marketing campaigns attract new visitors.
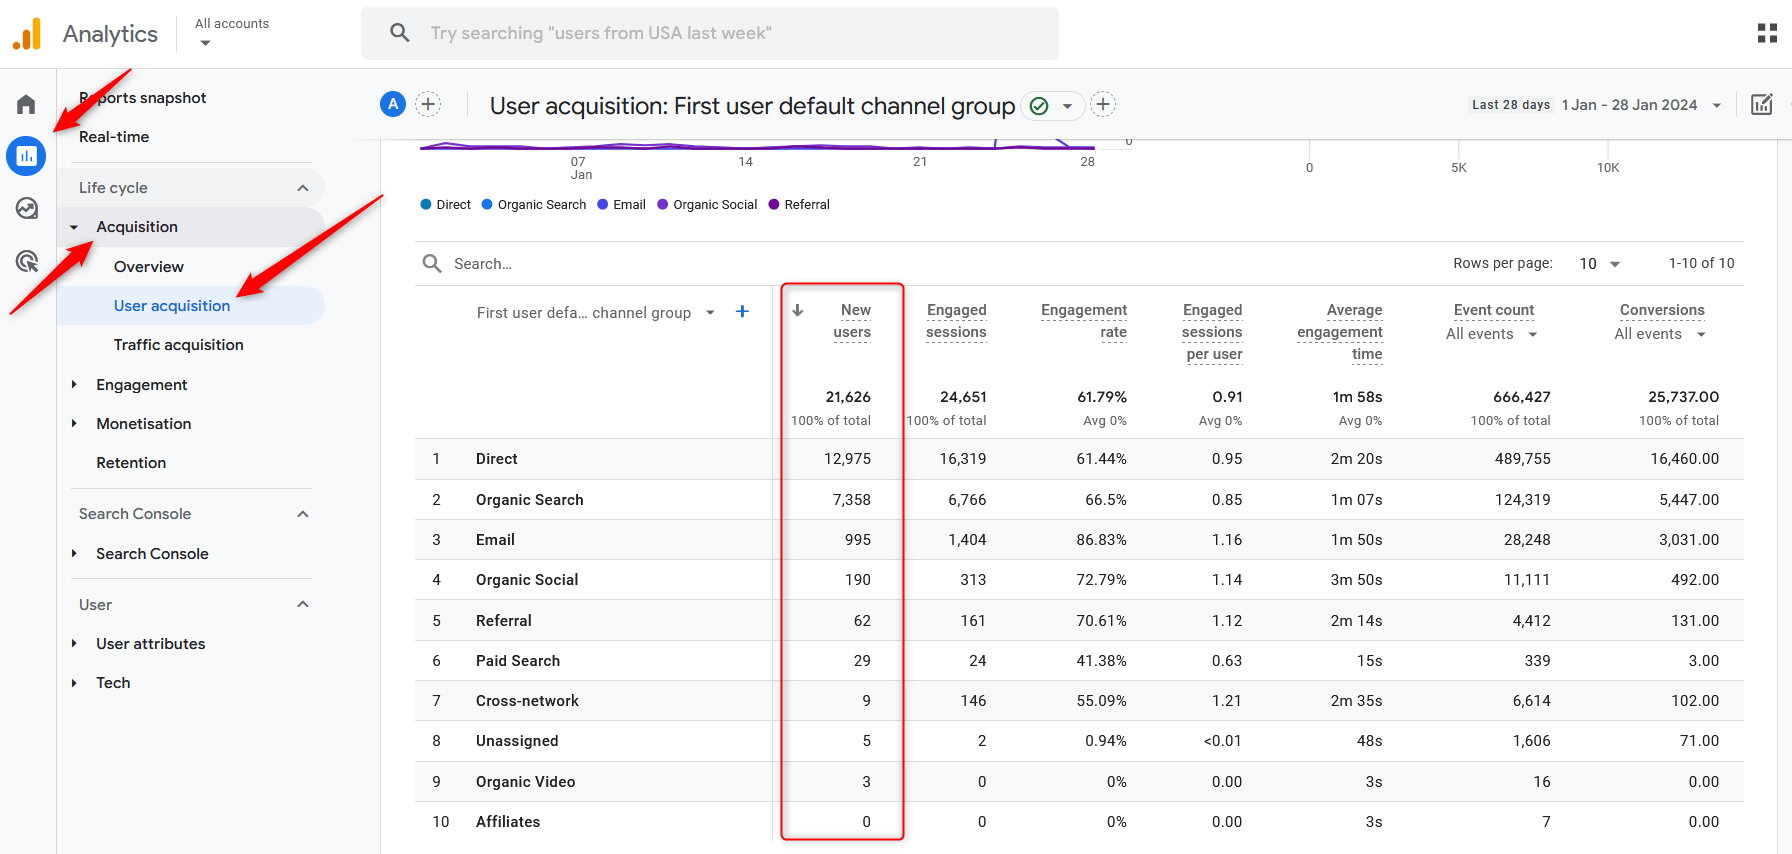
To see how many new users your website has acquired, simply go to Acquisition->User Acquisition report and have a look at the New Users column:
Returning Visitors
As the name suggests, the metric Returning Visitors grants the overall number of site visitors who have visited your website more than once.
The greater the number of returning visitors, the more engaging and useful your website is, so when analyzing your GA4 reports, definitely check the ratio between new and returning visitors and make sure you improve your website, so more people return to it.
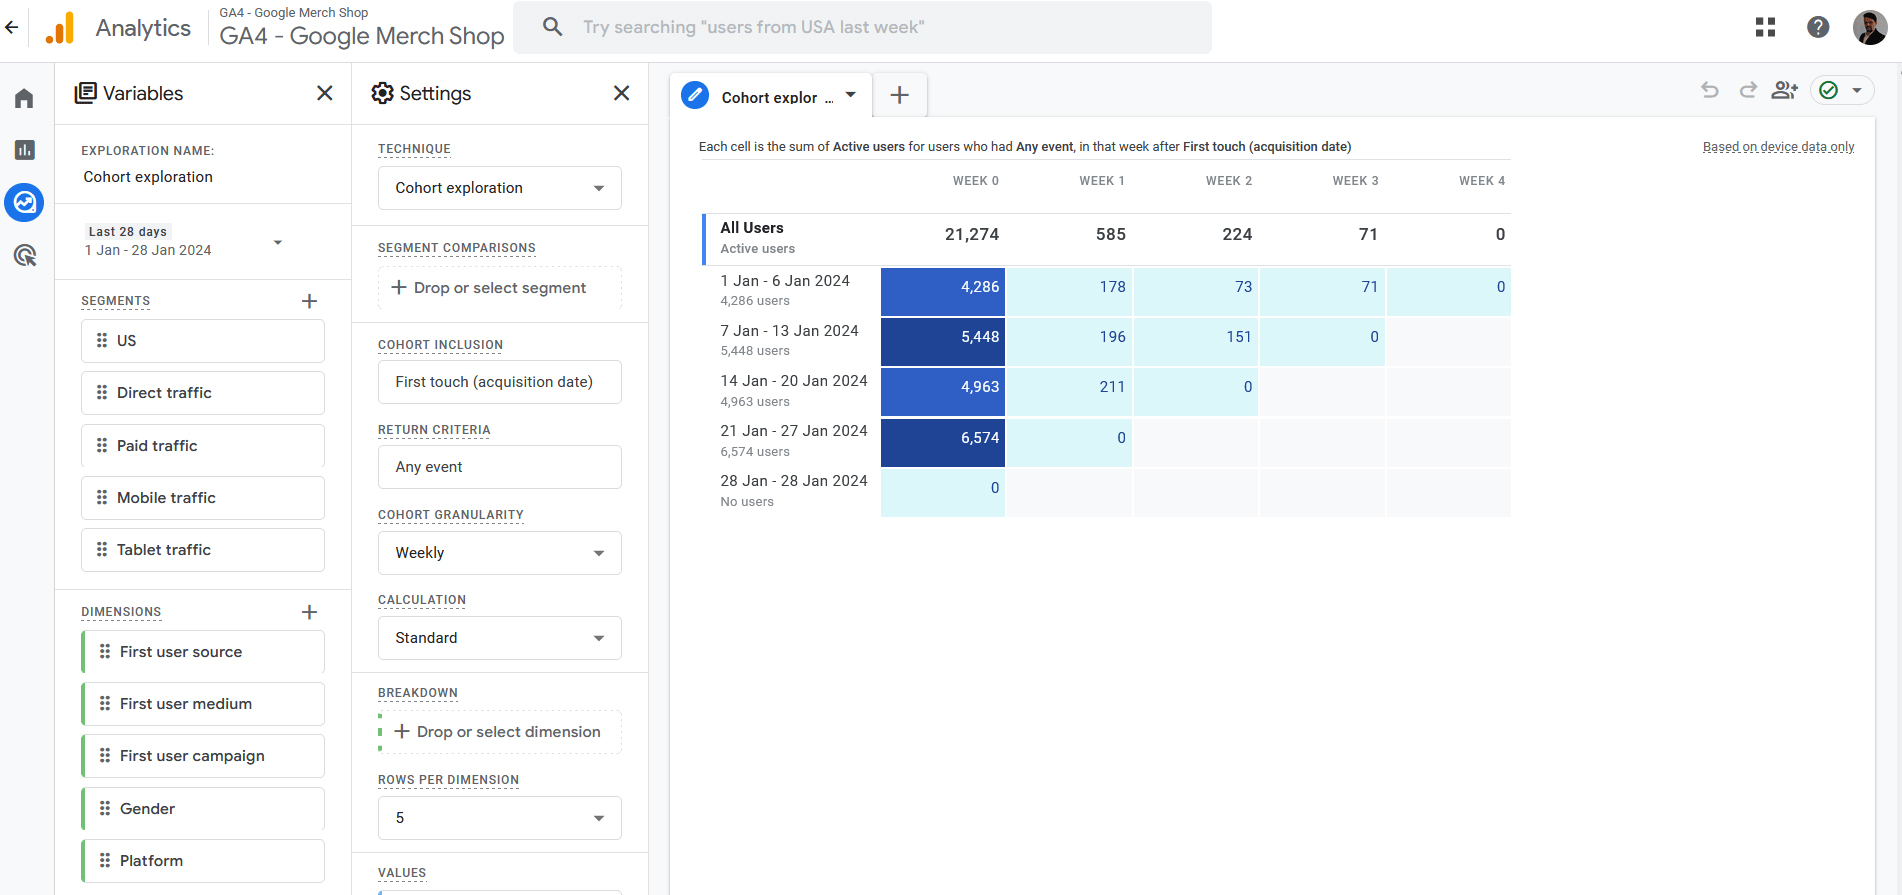
To monitor the number of returning customers, go to Explore and click on Cohort exploration:

This will open the cohort chart that can help you get a deeper understanding of your returning visitors:
Conversion Rate
Conversion rate is a metric calculated in percentage and reveals how many visitors have triggered an event.
The greater the conversion rate, the better your website performs in turning visitors into leads and customers.
Here’s the formula that is used to calculate your conversion rate:
Conversion rate = number of users who triggered an event on your website/total number of users for the same period.
Here’s an example:
If your website had 2000 visitors for the past month and 60 of them triggered an event, then to calculate the conversion rate for that period, you simply divide the number of conversions to the overall number of visitors for that period and multiply the result by 100:
60/2000 x 100 = 3%
Landing Pages
Landing pages is a term referring to the page of your website a given user first opens.
This metric is important, as it helps you understand how your marketing endeavors are performing in several ways:
- Monitor whether visitors follow links you have included in your marketing campaigns
- Monitor which pages are most visited via organic search and therefore use this data in your SEO endeavors.
- Monitor which pages your social media followers first open when coming from such a medium.
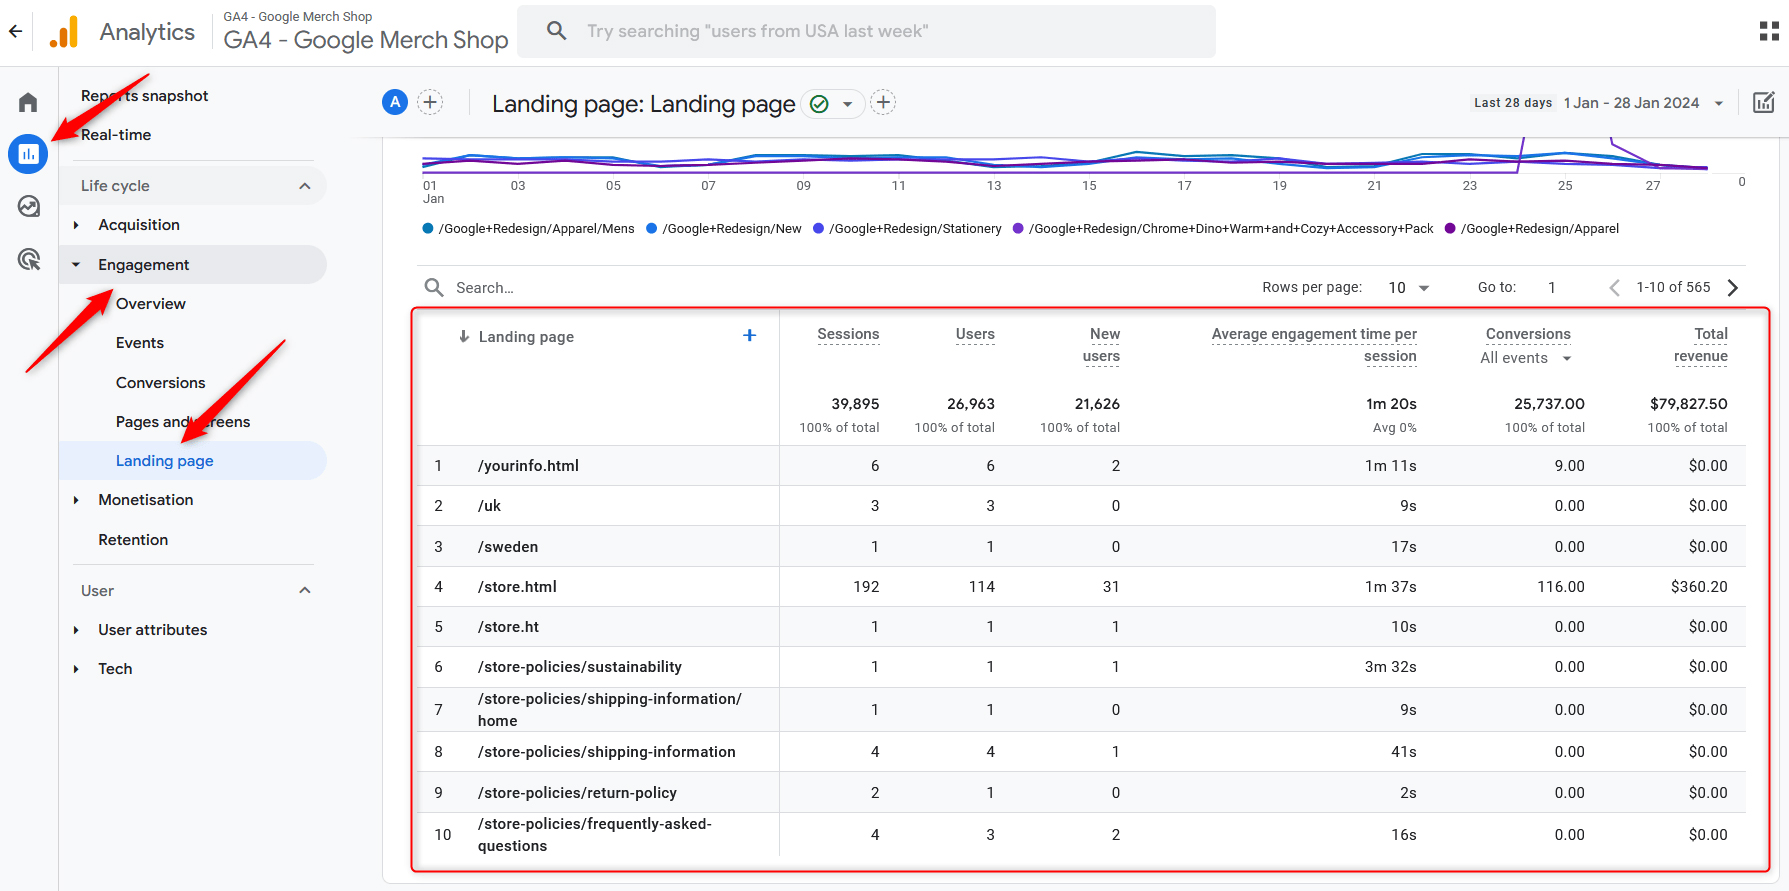
To check your landing page report, simply go to Reports->Engagement->Landing Page:
Exit Pages
Some pages on your website eventually become the last page of a given session.
If you are working on a blog website, it is normal for users to read a publication or two and then close the website.
However, if you work on an e-commerce website, or anything else that is purchase and subscription-focused and visitors leave your website via the checkout page, or the purchase phase, then you have a problem.
Checking out which pages become exit pages on your website can help you understand whether your website and content are performing well or if there is something to be fixed.
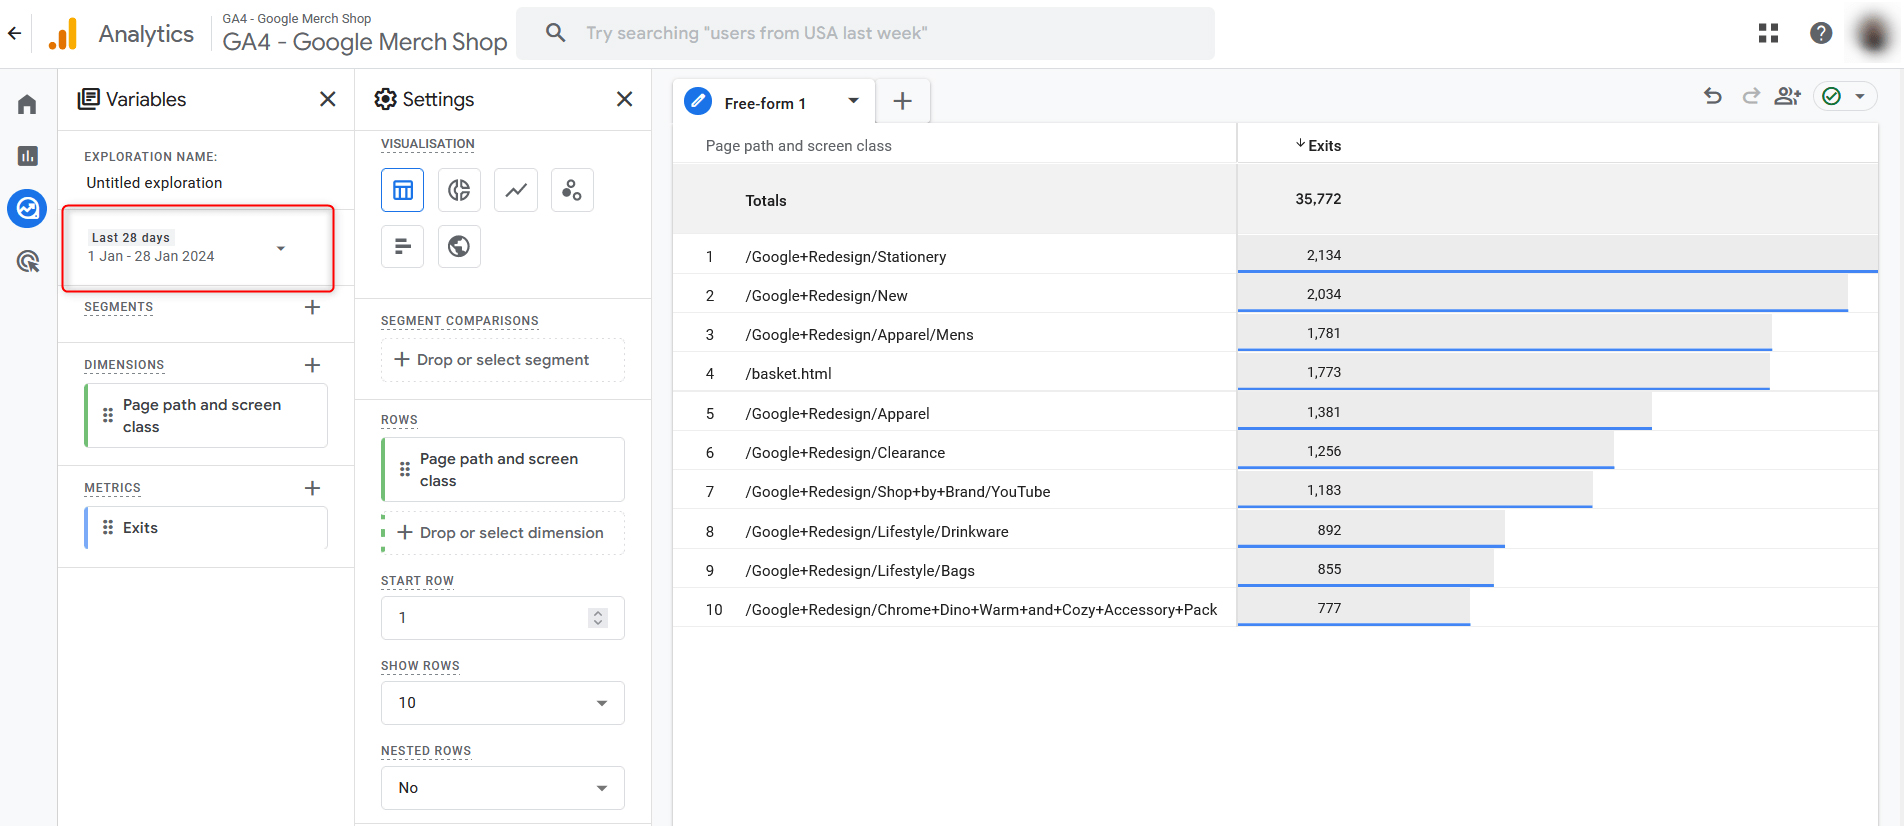
Since exit pages are not included in standard reports, you should use the Exploration tab to create a custom report.
Here’s how to do so:
First, go to Explore:
Then, select the blank template from the explorations page:

Once the template loads up, go to Dimensions:
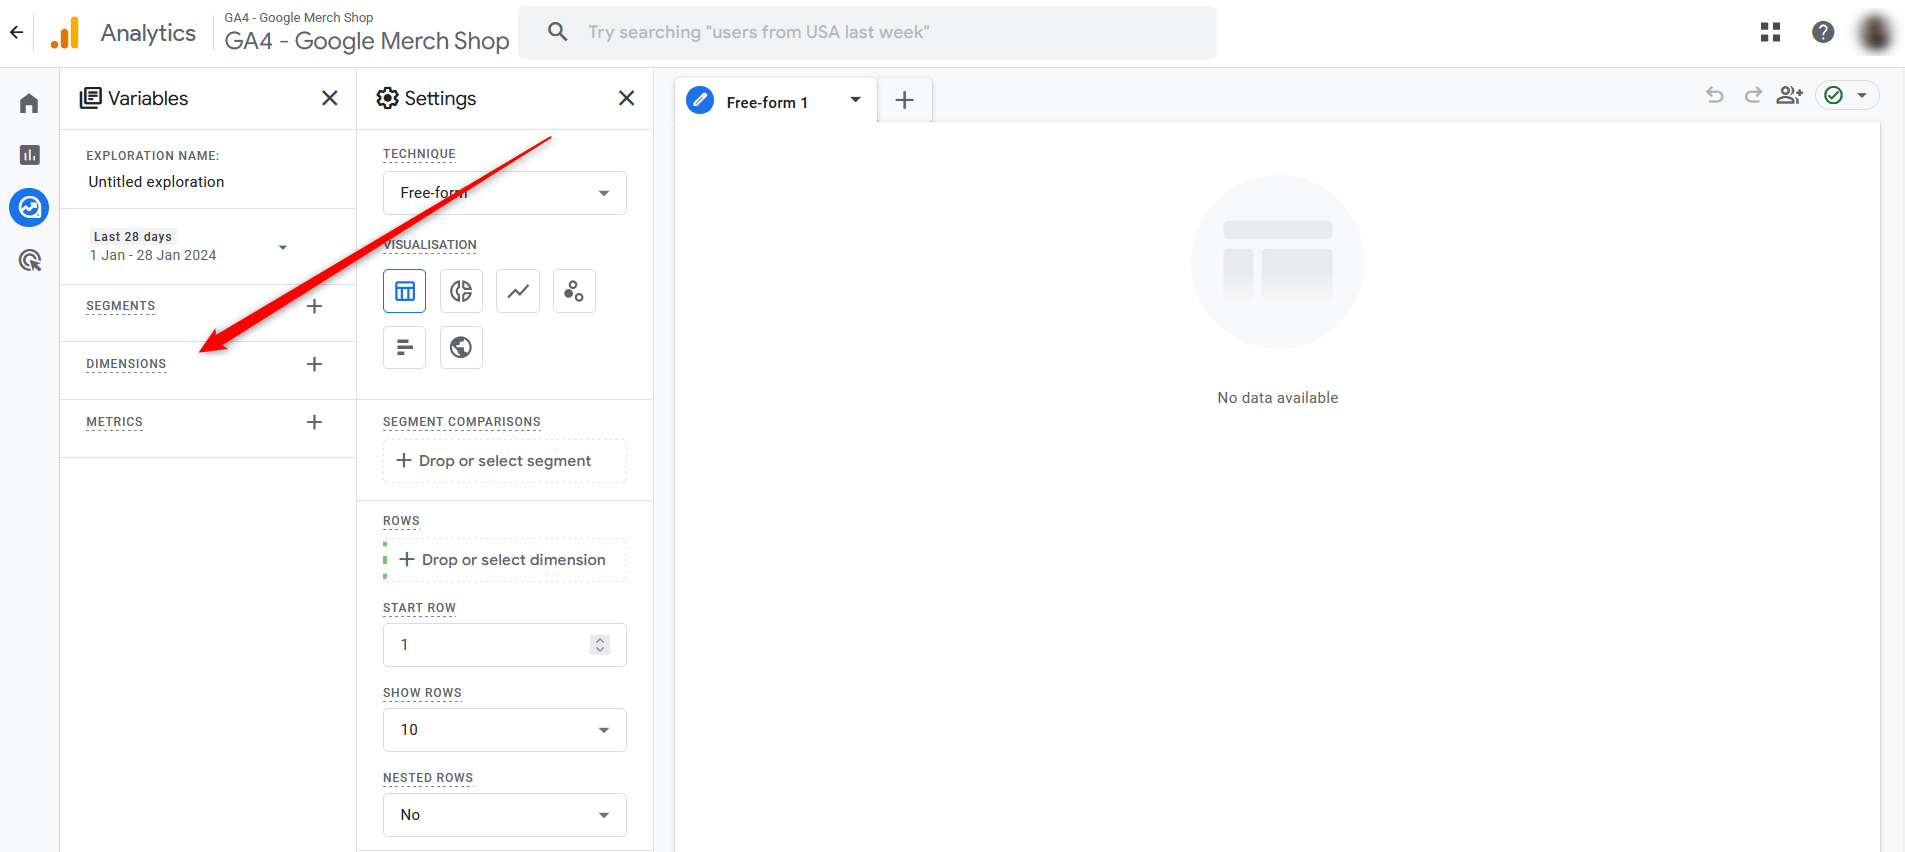
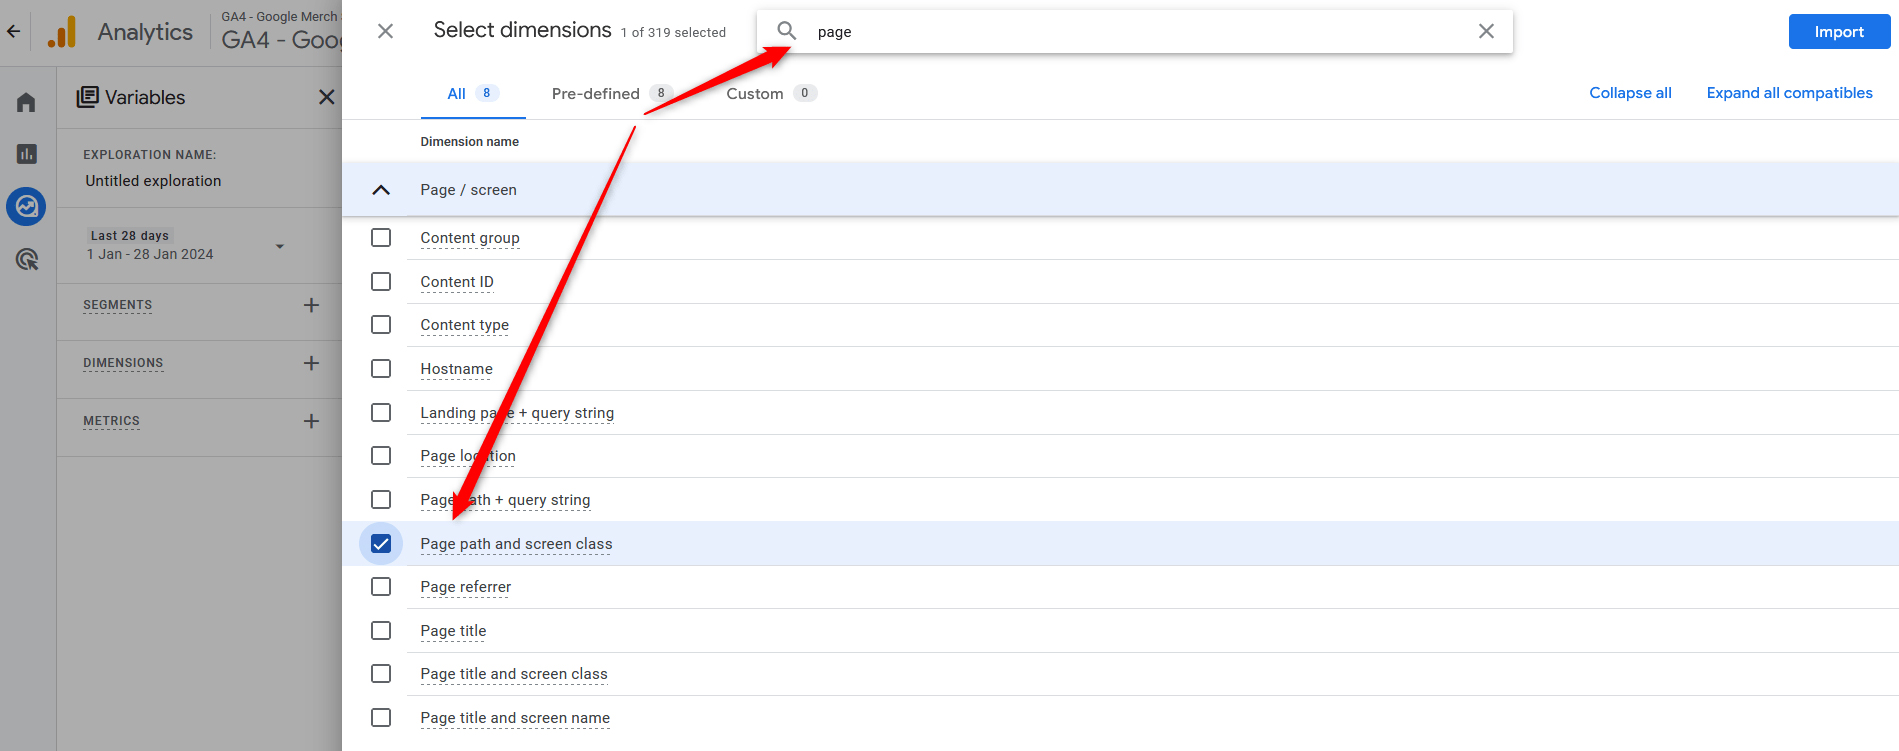
Once the Dimensions tab is open, search for Page path and screen class (you can use the search function for faster results):
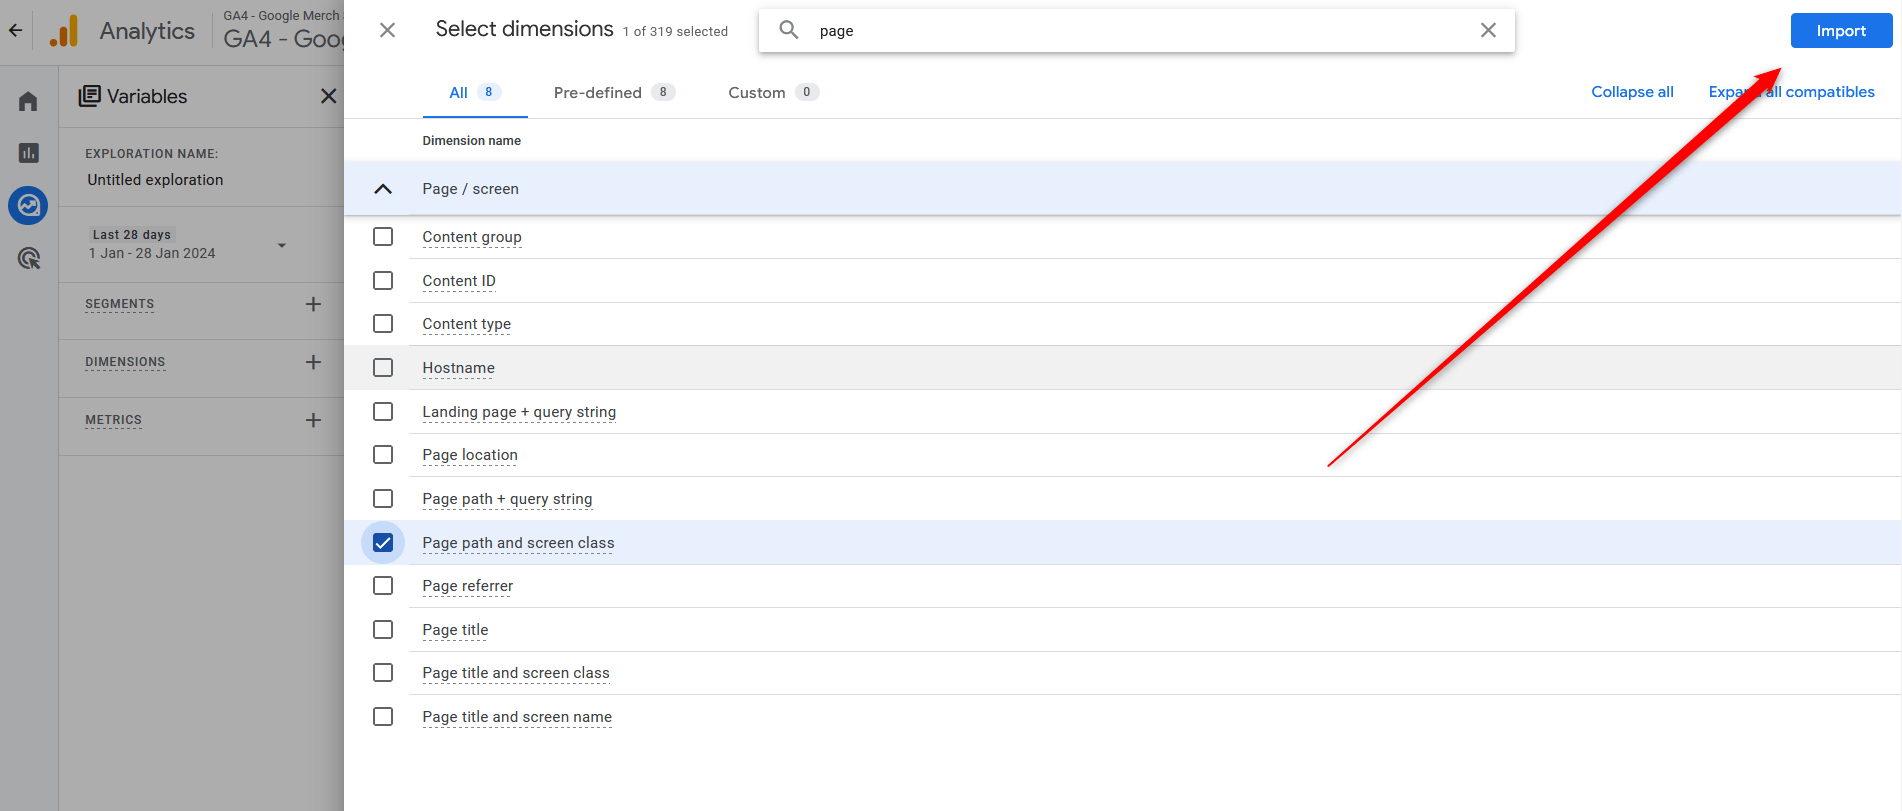
Now, include this dimension in the report by clicking the blue Import button at the top right of the screen:
Now that you have included the dimension, click on Metrics:
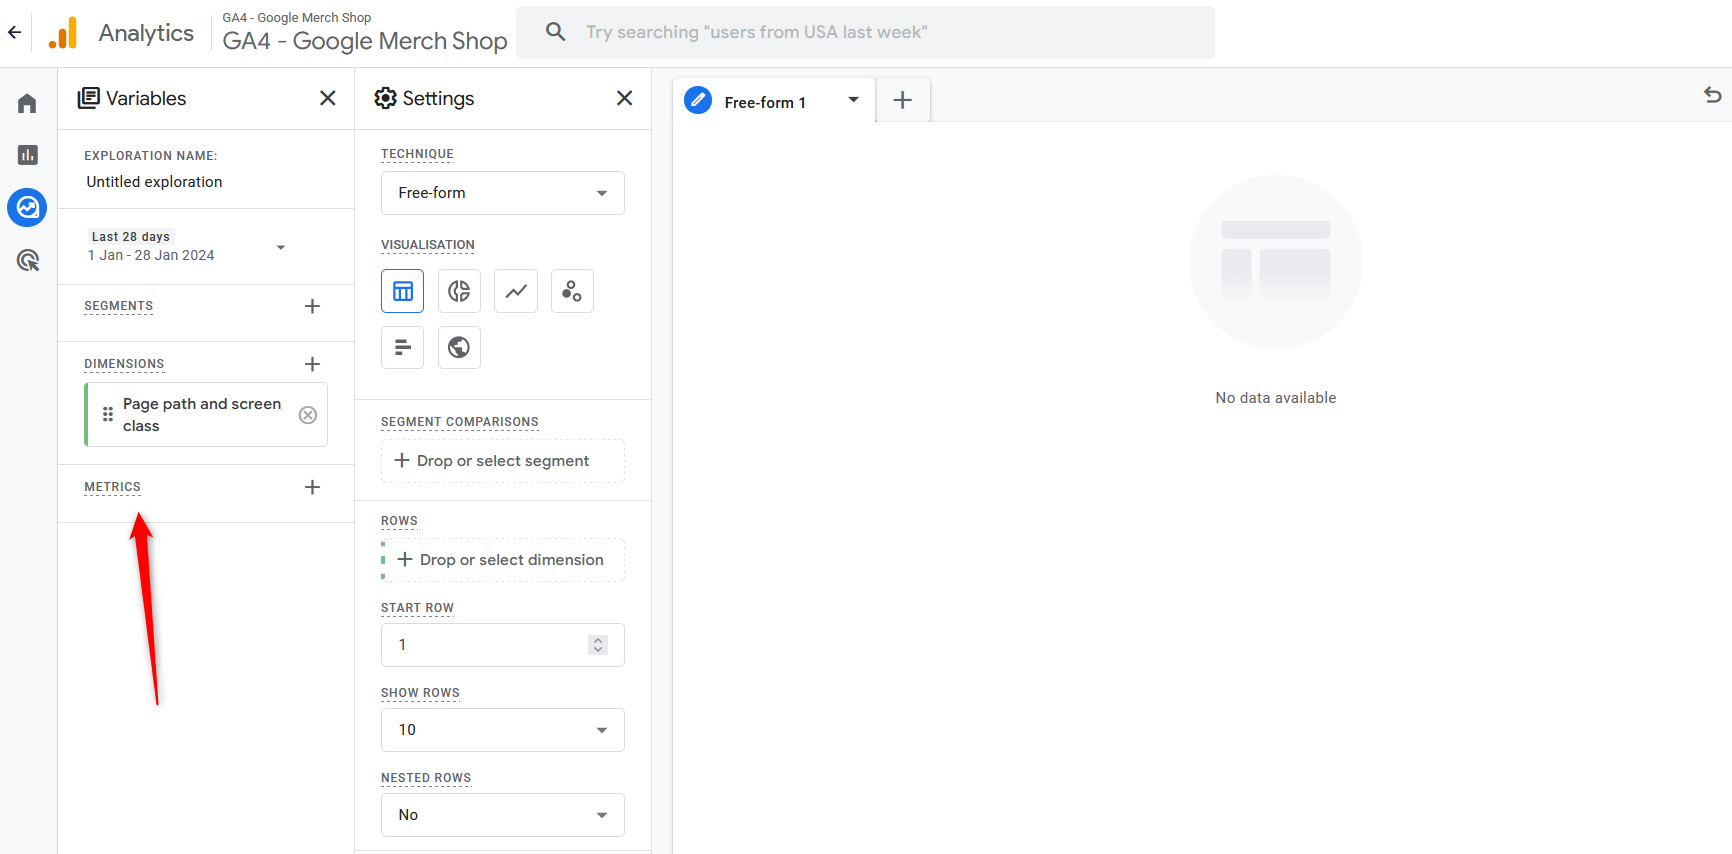
From the new menu that would pop up, search for Exists under Page/screen:
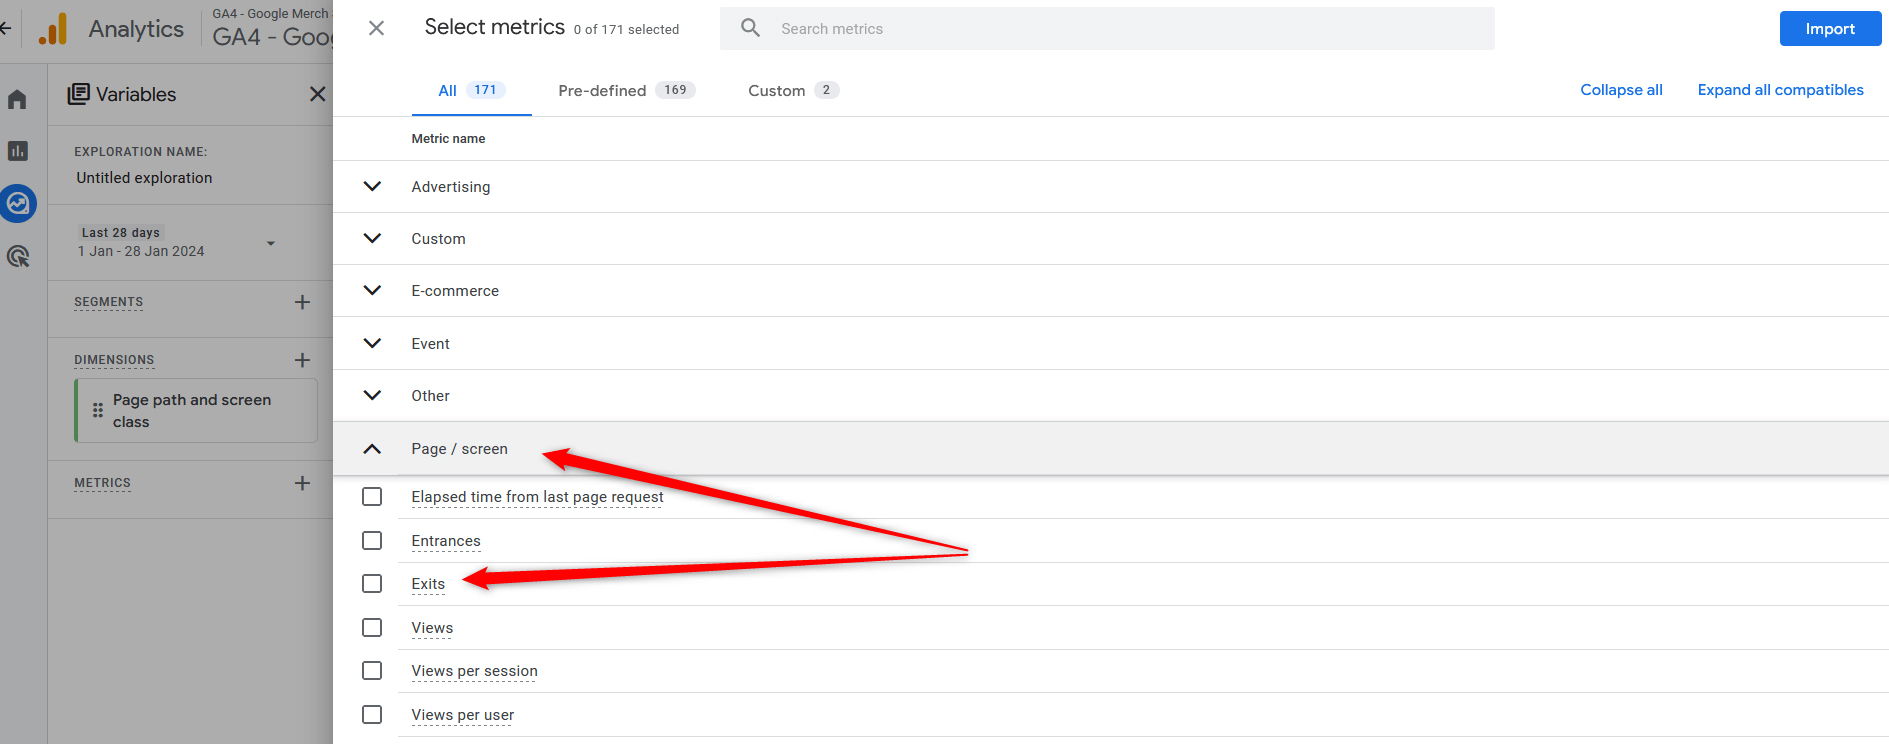
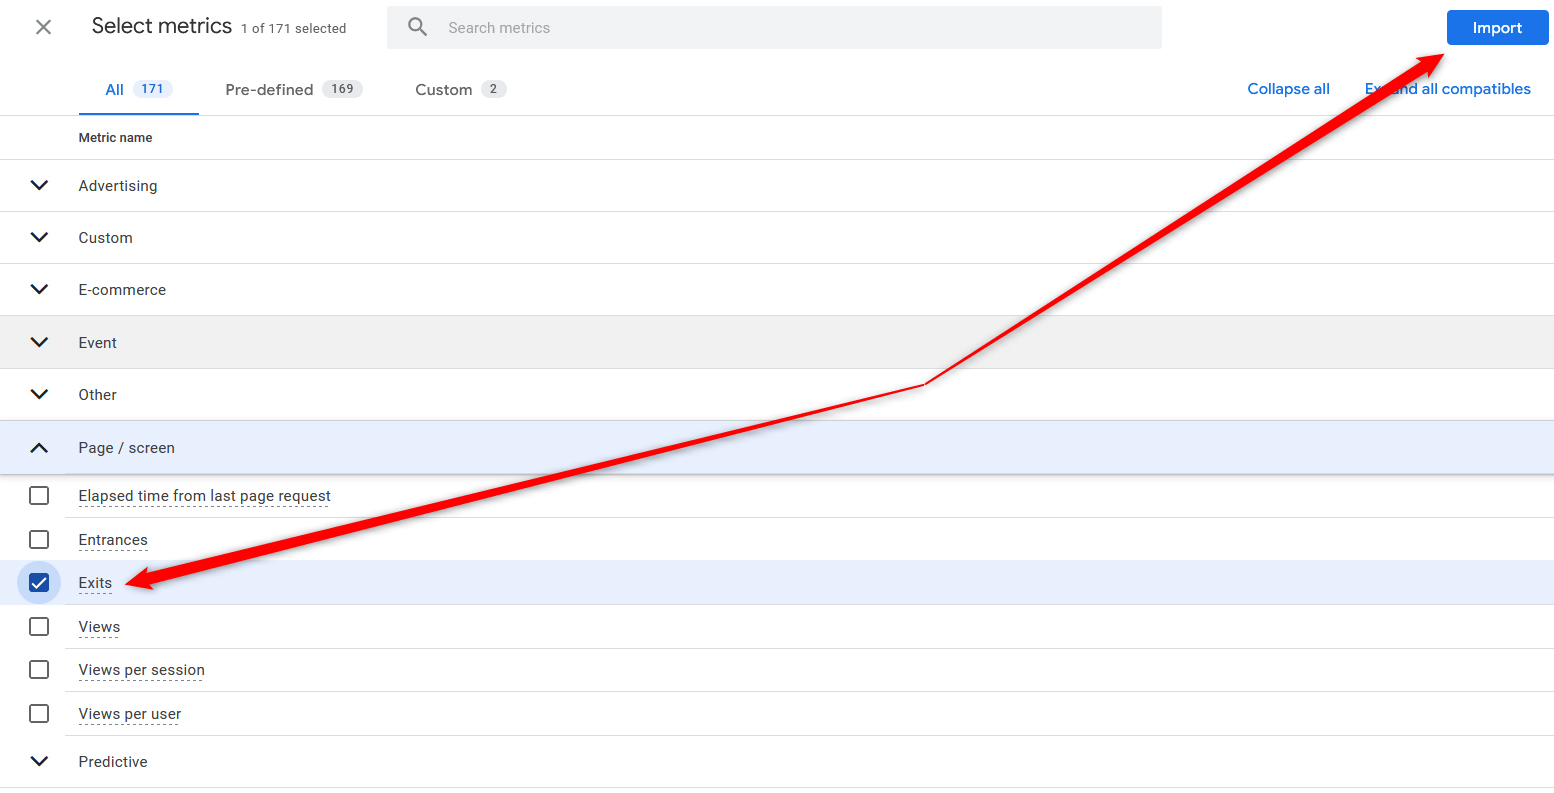
Add a tick to Exits and then click the blue Import button at the top right of the screen:
Now that both dimensions and metrics are filtered, GA4 will show you a list of your exit pages:
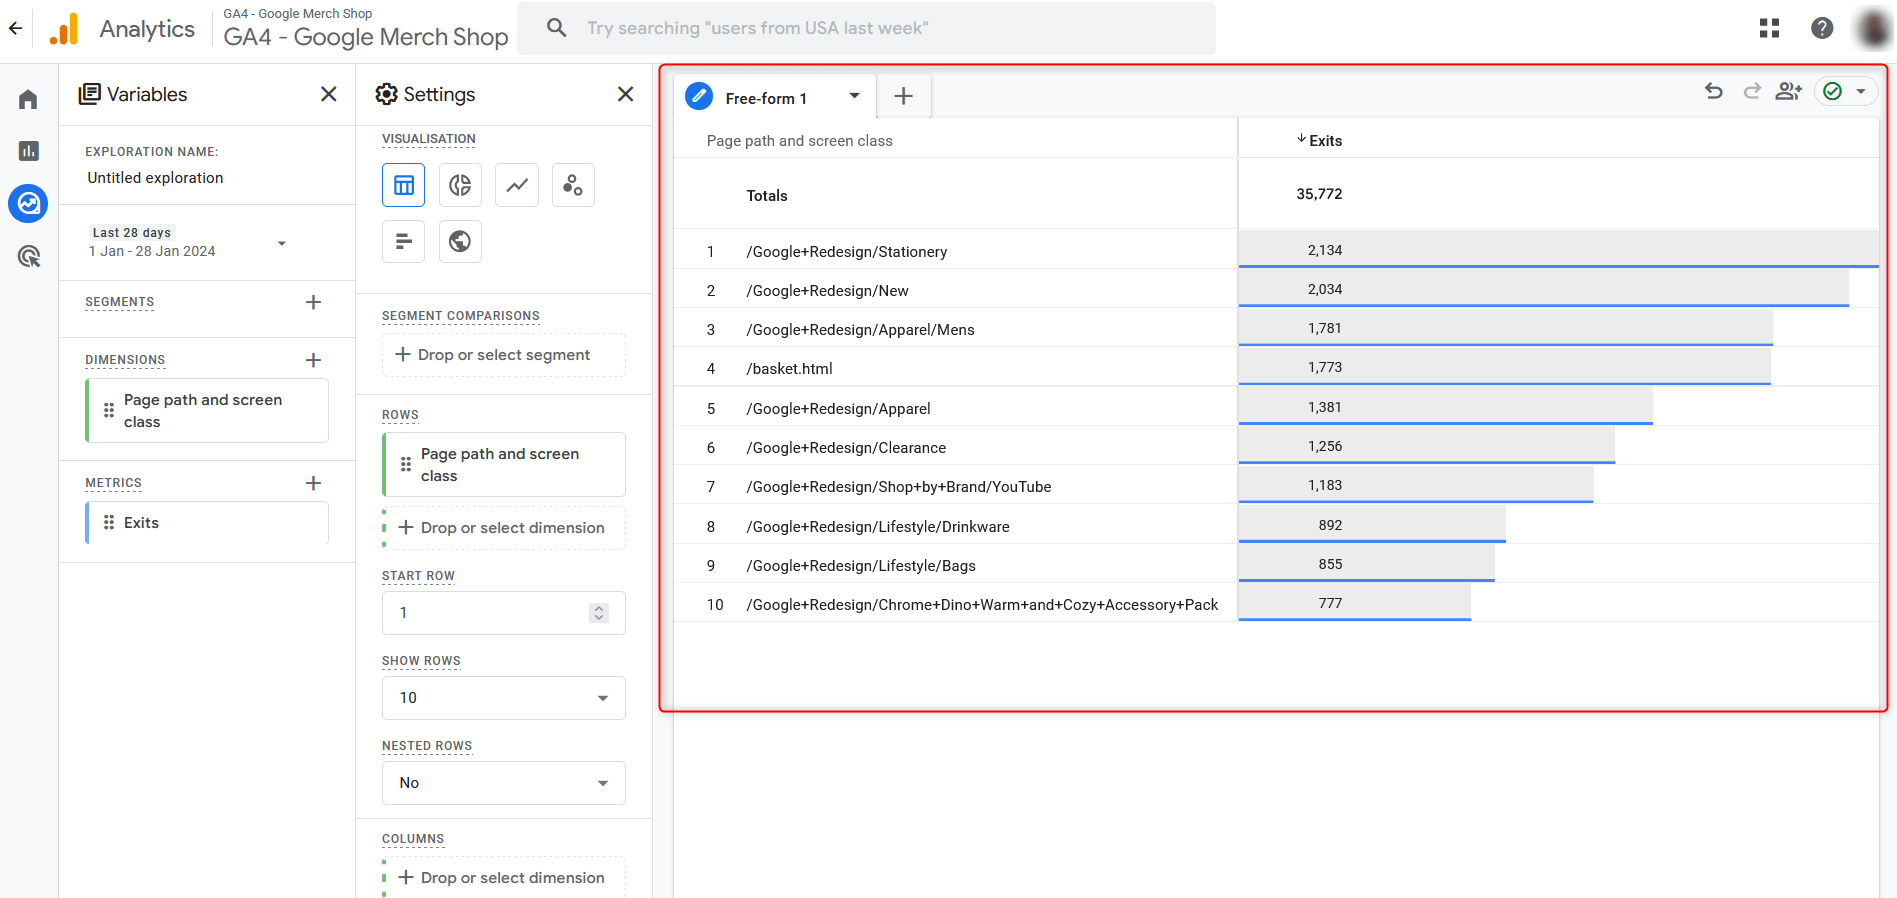
You can change the period:
12 Most Important Website Metrics to Track in Google Analytics 4 – Conclusion
Google Analytics 4 grants you access to numerous metrics that can be used in various situations.
In this article, you read about what is a metric in Google Analytics 4, which ones are the most important, and how to access them.
